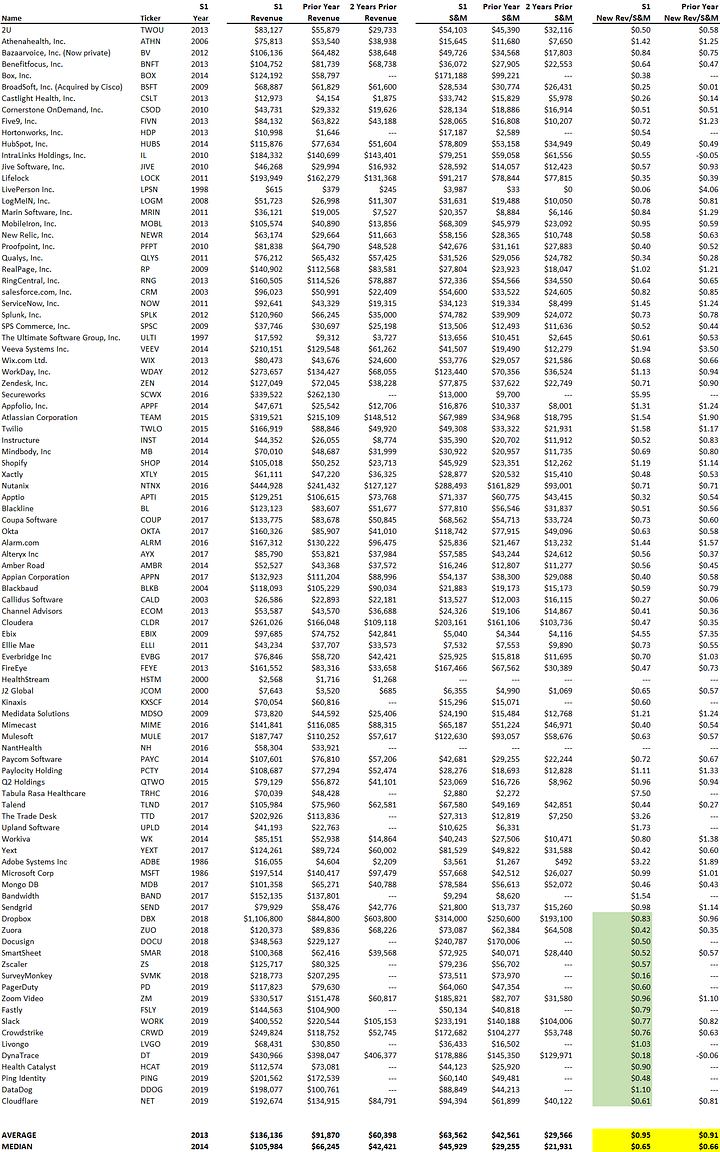
Does the Sales & Marketing function at big software companies scale? The data says no. We looked at new revenue divided by sales and marketing spend of SaaS companies at the time they went public. We then compared that figure to the same calculation the year prior to going public. In other words, if in a given year revenue grew from $100mm to $150mm while S&M spend was $80mm, the ratio would be ($150-$100)/$80mm resulting in $0.63 of new revenue for every $1 in S&M spend that year. In a situation where there were real economies of scale, we would expect that $0.63 to improve the following year as the company gets bigger.
Our data set has 96 SaaS companies who went public (filing their S1 prospectus). At the time of filing, the figure above was $0.65 cents on median and $0.95 on average. In other words, the typical SaaS company generated $0.64 of new revenue for every dollar of marketing spend. The year prior to the public filing though, the figure was $0.66. So even though these companies had median revenue of $105mm in the year they filed to go public and $66mm the year prior, they did not get more efficient. The data is below.
The median year these companies went public was 2014, so how does that same metric look today? The green highlighted section isolates SaaS IPO’s in the past 2 years; the median and average were $0.61 and $0.66 respectively. While you may expect larger companies to benefit from economies of scale and be more efficient in selling, the data says otherwise.
Visit us at blossomstreetventures.com and email us directly with Series A or B opportunities at. We invest $1mm to $1.5mm in growth rounds, inside rounds, and other ‘special situations’ all over the US & Canada.