One of the most important metrics for B2C companies is customer acquisition cost or “CAC”. In order to understand how CAC trends for successful tech companies, we took a look at publicly available data for B2C companies which disclosed CAC. While we found only 4 companies that mention the metric, the data was interesting, and somewhat varied.
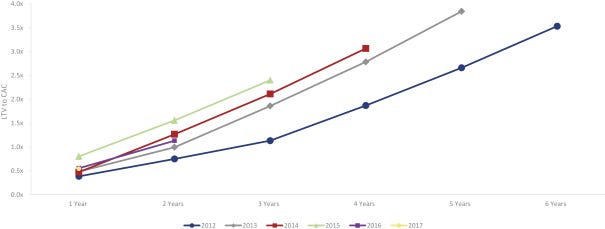
Chewy’s LTV to CAC seems to be declining. Chewy doesn’t disclose CAC or LTV individually, but does disclose the ratio. The chart below shows the 2015 and 2014 cohorts seemingly performing better than the 2016 and perhaps the 2017 cohorts. According to Chewy’s prospectus “We measure LTV on a rolling three-year basis, which, as a multiple of acquisition cost, was 2.4x for our most recent 2015 cohort, and continues to grow as it ages. We have included a chart below that shows the ratio of LTV to CAC for the 2012–2017 cohorts. Our most recent cohorts had similar behavior for ordering our products as prior cohorts.” While older cohorts performing better than new cohorts isn’t what you want, it’s not unusual (early adopters are typically cheaper to acquire). In addition, keep in mind Chewy’s marketing expense is growing every year: advertising and marketing expense was $254mm and $393mm in 2017 and 2018 respectively (11% to 12% of net sales).
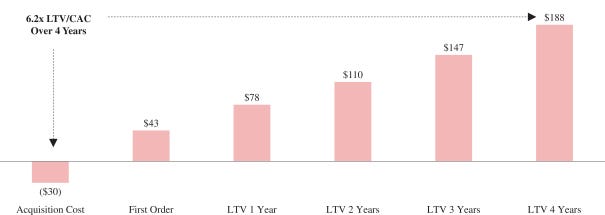
Revolve has nice economics. Revolve disclosed CAC and LTV data only for their 2014 cohort: “in 2014, we spent approximately $7.2 million in acquisition marketing to acquire 242,318 new customers in the 2014 cohort, resulting in an approximately $30 CAC for that cohort. This cohort generated a contribution profit of approximately $43 per customer on the first order, which demonstrates our ability to achieve rapid payback and profitability. Furthermore, the LTV of the 2014 cohort has increased over time driven by repeat purchases and rising contribution margins. As a result, the LTV of the REVOLVE segment’s 2014 customer cohort was approximately $188 after four years, 6.3 times the $30 cost of acquiring those customers, which is a testament to our ability to acquire customers efficiently and profitably.” That’s excellent performance and what you should strive for: be profitable on the first purchase and keep the customer coming back.
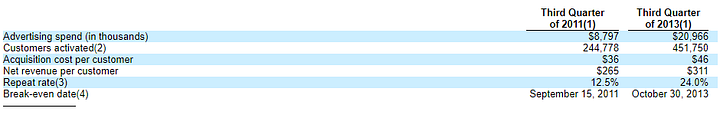
Wayfair’s CAC grew by 12% annually while marketing spend increased 2.3x. Wayfair, an online purveyor of housewares, reported CAC of $45 in Q3 2013 versus $36 in Q3 2011. While that seems like high growth in CAC, it’s nominal when you consider that marketing expense increased from $9mm to $21mm over that same time. Overall, CAC grew at a compound annual growth rate of 12% each year, which is acceptable given that marketing spend more than doubled over the same period.
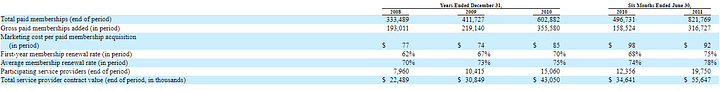
Angie’s List had stable CAC, while tripling marketing spend. Angie’s List, an online review site with memberships, had very little change in CAC from 2009 to 2011 with CAC of $74, $85, and $78. Over the same period, paid memberships went from 411k to 1.1mm and marketing expense rose from $16mm to $56mm. In other words, marketing expense more than tripled but CAC stayed the same. That’s remarkable scale.
Visit us at blossomstreetventures.com or email Sammy directly atespecially if you have a Series A or B opportunity.