Before we get into the meat of this post, first, a quick refresher: a cohort is a group of customers acquired at a particular time; for instance the “January 2018” cohort would be those customers who were acquired in January 2018. One very important measure in SaaS is cohort growth. Often times this is depicted in the form of a chart in which the revenue of the cohort is shown over time. Examples from the prospectus’ of Cloudflare, Datadog, and Livongo are below. A chart that is sloping upwards and to the right is what you want as it means your cohorts are a source of revenue growth (you are expanding bookings within the existing customer base), and the steeper the slope the better. Additionally, upward sloping cohorts mean net dollar retention is in excess of 100%, which is where you want it. For instance, Datadog enjoys net dollar retention of 146%, which is remarkable; net dollar retention is the difference between the ARR of a customer cohort when you first acquired them and ARR at some point in the future, usually 1 year later.
Charts of each of these companies as well as commentary from their prospectus’ (s1) is below.
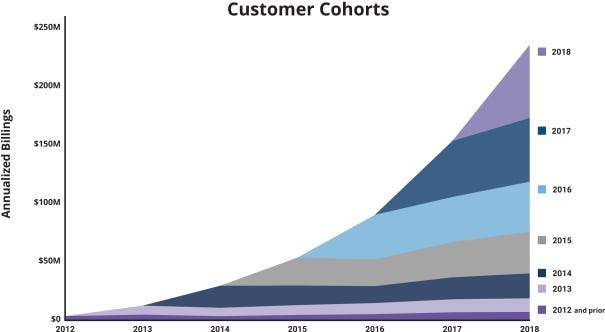
Cloudflare: “We are uniquely positioned due to our distinct advantages to grow with our customers as they add new Internet properties or expand the usage of our global cloud platform within their organizations. We have grown our Annualized Billings with our paying customer base over time as the needs of those organizations grow and expand as well. The below chart illustrates the growth in Annualized Billings for cohorts of customers that first became paying customers in each of the years from 2011 to 2018, and demonstrates how we attract new paying customers and expand their Annualized Billings with us over time.”
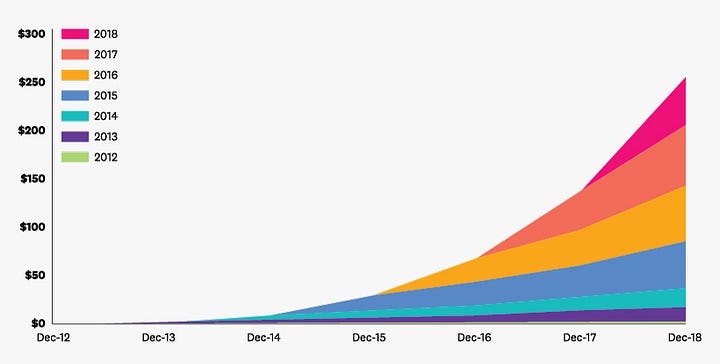
Datadog: “Once our platform is deployed we have experienced significant expansion historically, with customers engaging with our customer success team as well as increasing usage and spend in a self-serve manner. The chart below illustrates this expansion by presenting the ARR from each customer cohort over the years presented. A further indication of the propensity of our customer relationships to expand over time is our dollar-based net retention rate, which compares our ARR from the same set of customers in one period, relative to the year-ago period. As of June 30, 2018 and 2019, our dollar-based net retention rate was 146%, and as of December 31, 2017 and 2018, it was 141% and 151%, respectively.”
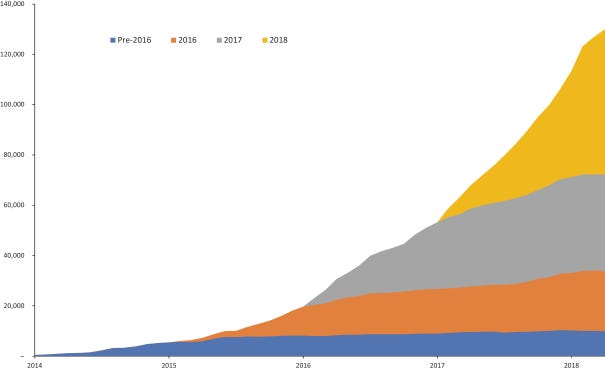
Livongo: “The chart below illustrates growth of diabetes members who have enrolled in Livongo for Diabetes and have satisfied contractual billing criteria for each cohort over the periods presented. Each cohort represents the number of diabetes members who first became a Livongo user in a given year. For example, the 2018 Cohort includes all diabetes members that first became a member during 2018.”
Visit us at blossomstreetventures.com. Email Sammy directly atwith Series A or B opportunities.